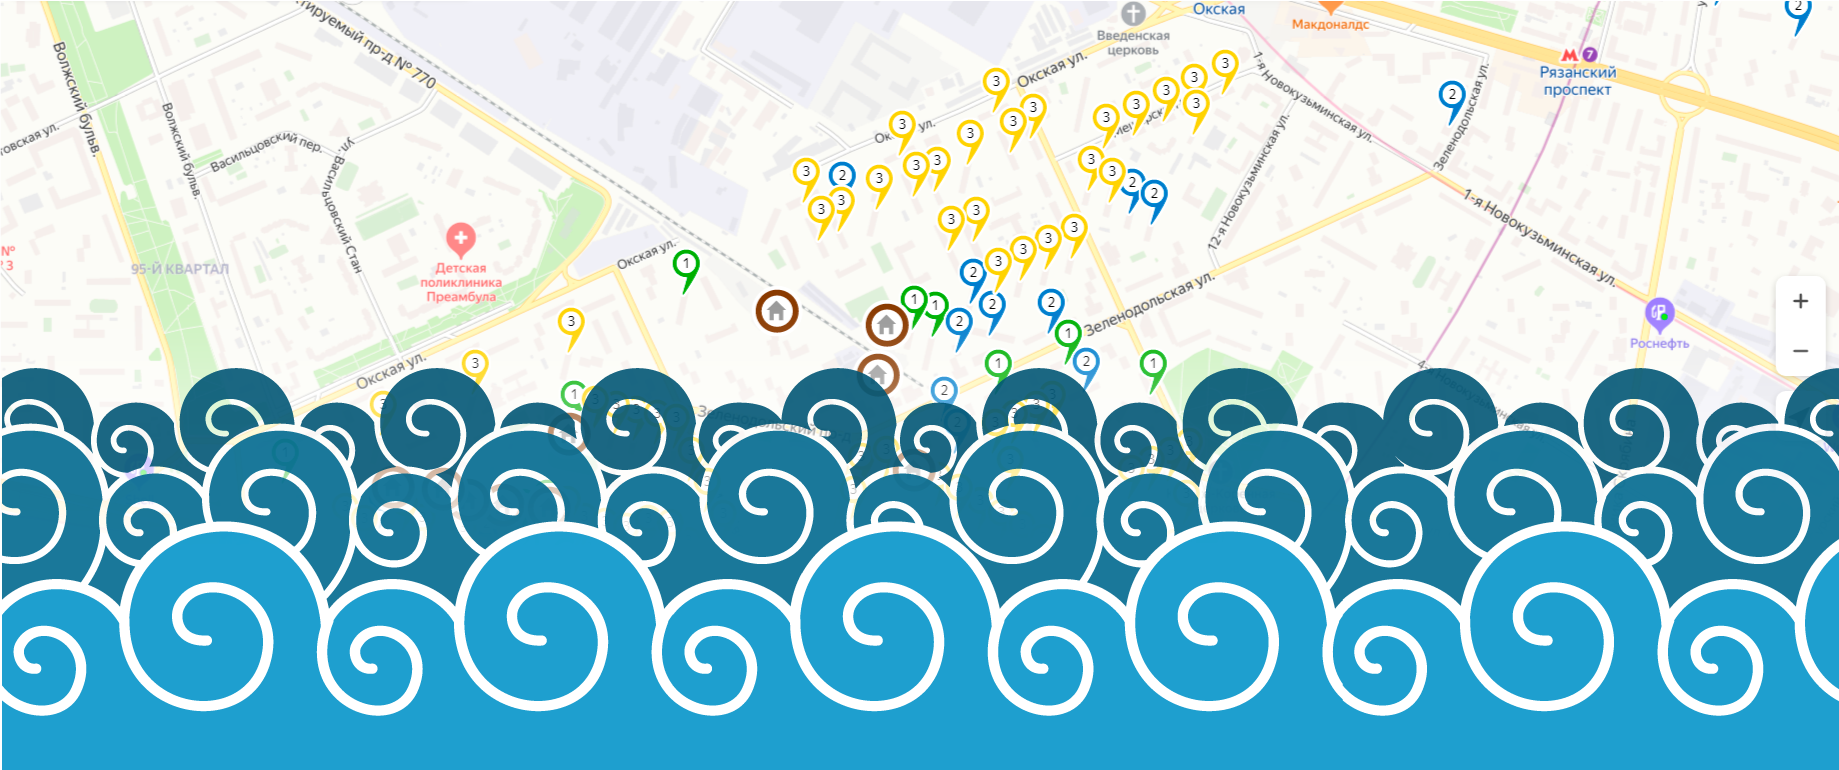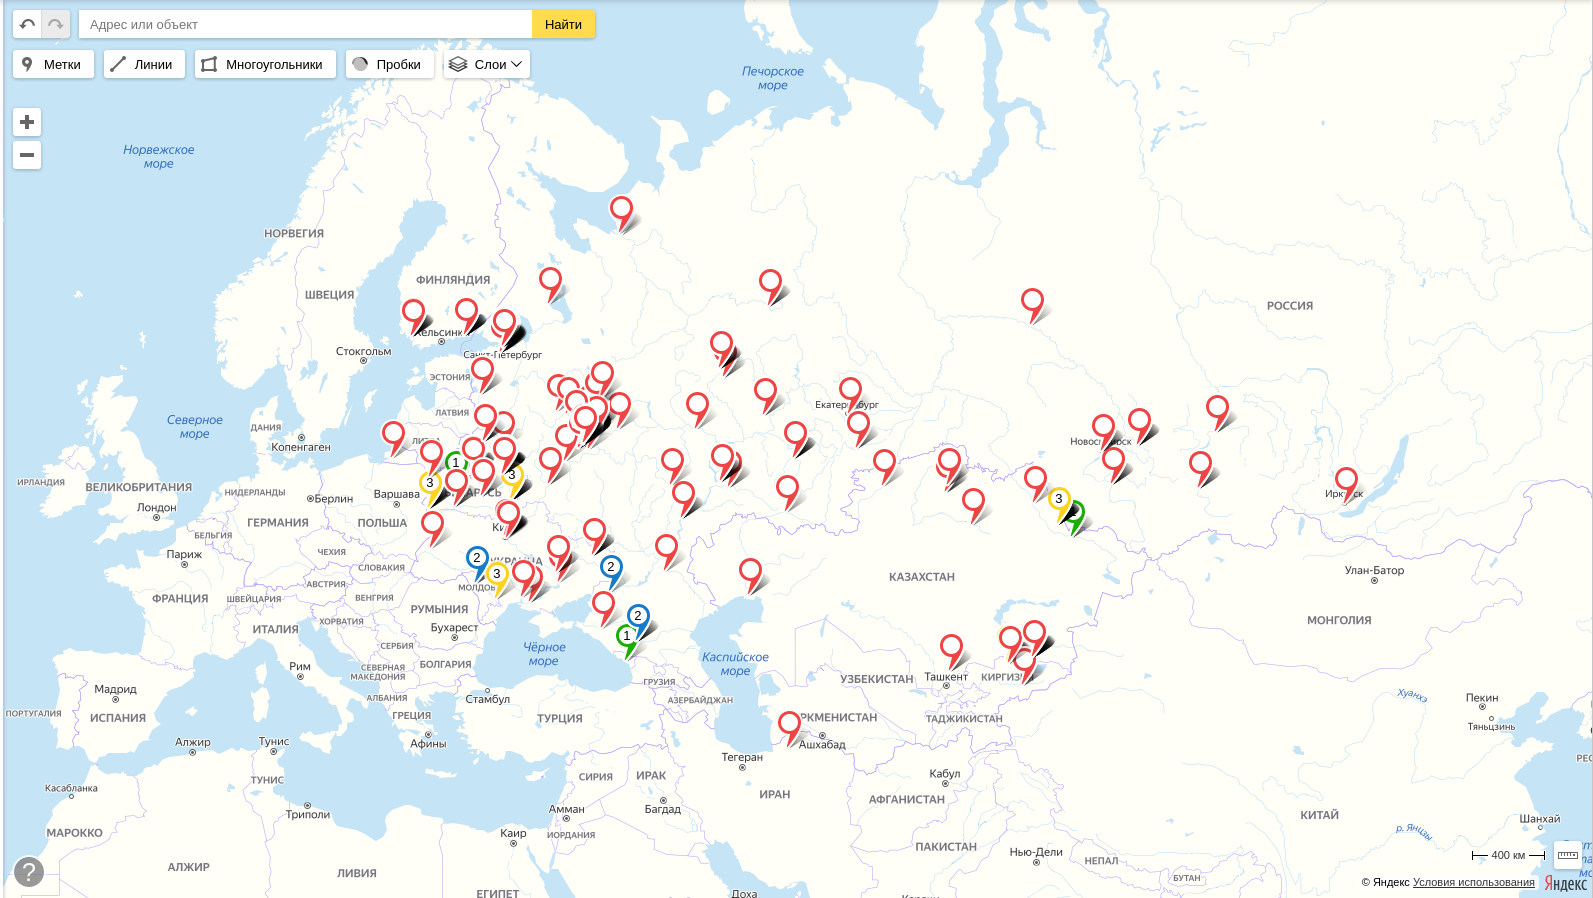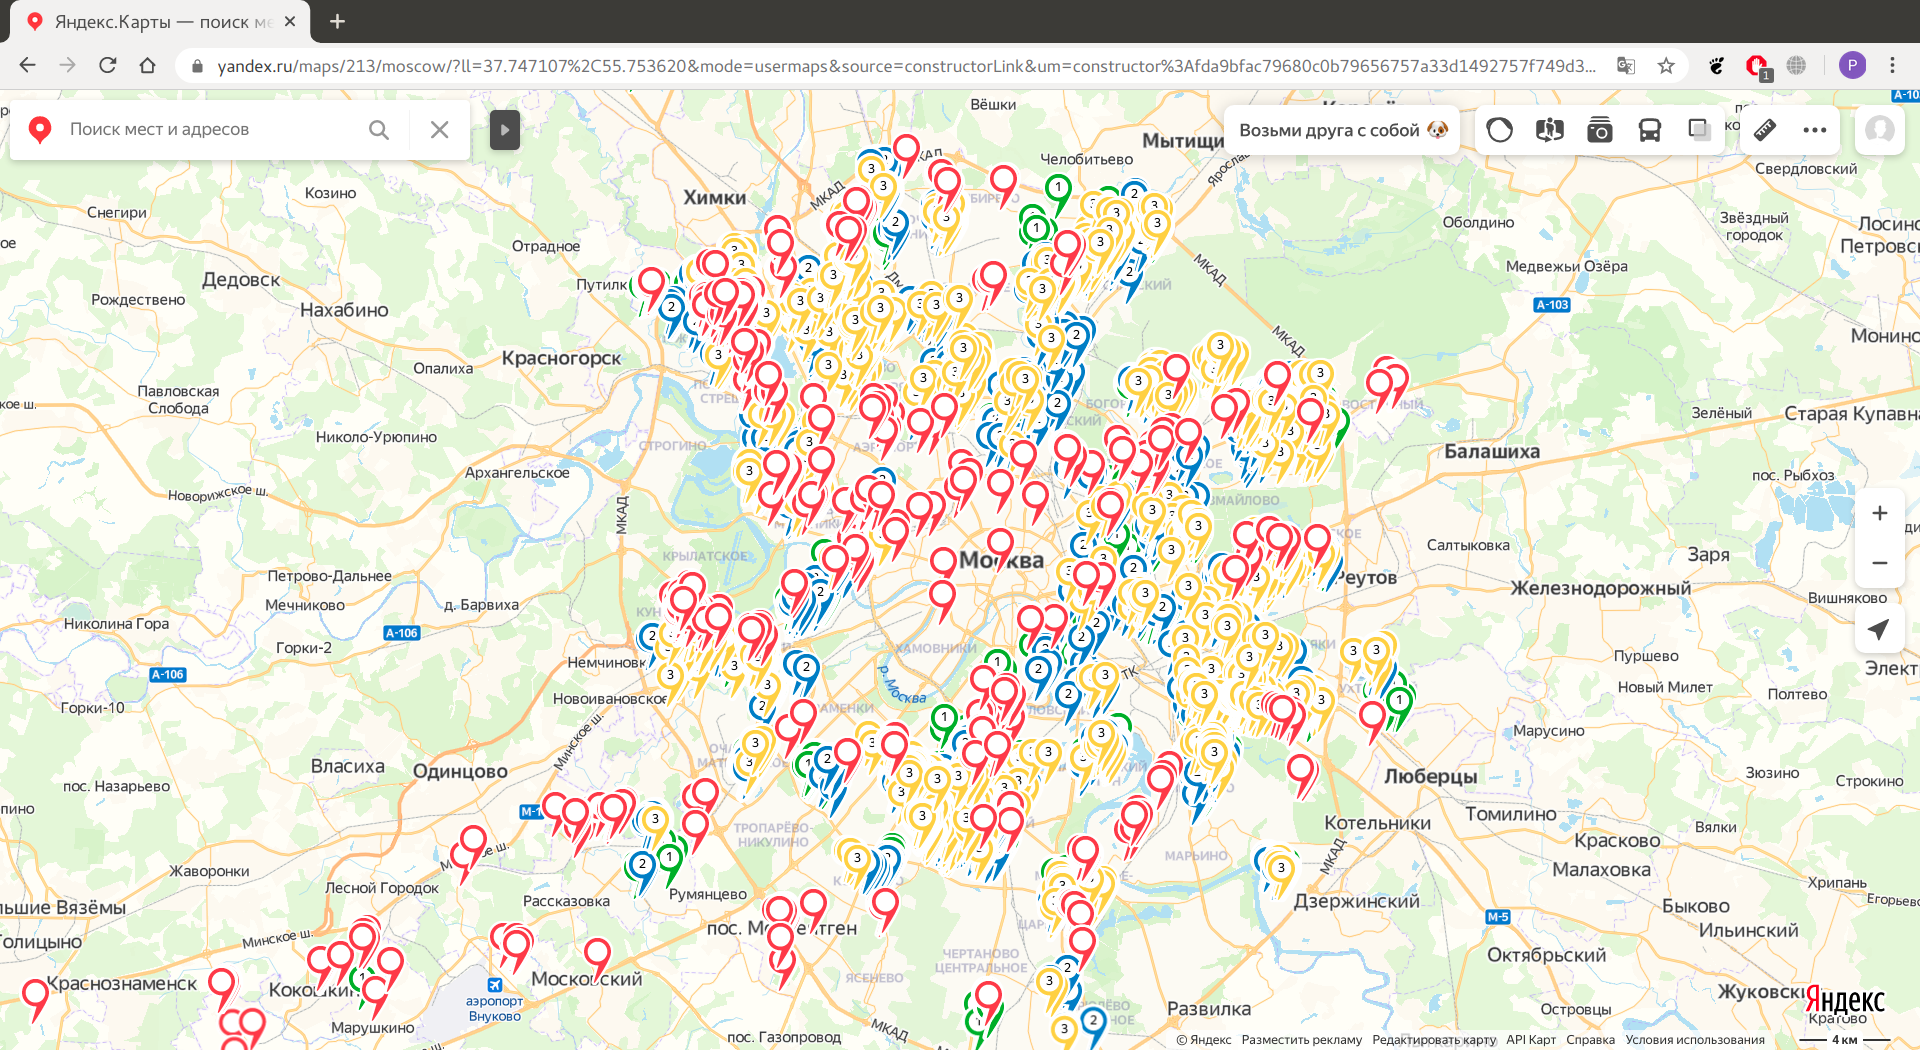
Bonjour, chers lecteurs de habr, le 12 août 2020, les étapes du déménagement dans le cadre du programme de rénovation ont été publiées (vous pouvez le trouver ici ) et je me suis demandé à quoi cela ressemblerait si ces étapes étaient visualisées. Ici, il est nécessaire de préciser que je ne suis en aucun cas lié au gouvernement de Moscou, mais je suis l'heureux propriétaire d'un appartement dans un immeuble à rénover, donc j'étais intéressé de voir, peut-être même avec une certaine précision, deviner où la vague de rénovation pourrait se déplacer dans mon cas (et peut-être dans le vôtre, si cela vous intéresse, cher lecteur). Bien sûr, une prévision précise ne fonctionnera pas, mais au moins, il sera possible de voir l'image sous un nouvel angle.
UPD 28 août 2020 Nous avons
une carte de rénovation complète avec les vagues de rénovation et les sites de lancement marqués dessus.
introduction
12 2020 . № 45/182/-335/20 ( ) 2032 ( ):
- 2020 — 2024., 930 , 3-29
- 2025 — 2028., 1636 , 30-76
- 2029 — 2032., 1809 , 77-128
- ( 1 2021.) — 688 , 129-148
- , . , .
, .. — pdf , tabula pdf .
import pandas as pd
import numpy as np
import requests
from tabula import read_pdf
import json
import os
, , .
test = read_pdf('prikaz_grafikpereseleniya.pdf', pages='3', pandas_options={'header':None})test.head()| 0 | 1 | 2 | 3 | 4 | 5 | |
|---|---|---|---|---|---|---|
| 0 | No / | NaN | unom | |||
| 1 | 1 | ., .49 c.4 | NaN | 1316 | ||
| 2 | 2 | ., .77 c.3 | NaN | 1327 | ||
| 3 | 3 | ., .2/26 | NaN | 19328 | ||
| 4 | 4 | ., .3 | NaN | 31354 |
, , , parse_pdf_table.
def parse_pdf_table(pages, pdf_file='prikaz_grafikpereseleniya.pdf'):
    df = read_pdf(pdf_file, pages=pages, pandas_options={'header':None})

    #
    df = df[~(df.iloc[:,0] == 'No /')]

    #
    df = df.iloc[:,1:4]
    df.columns = ['AO', 'district', 'address']

    return df
, , .. , pdf . ( , .. )
wave_1 = parse_pdf_table('3-29') # 2020 - 2024
wave_1['wave'] = 1wave_1.shape(930, 4)wave_2 = parse_pdf_table('30-76') # 2025 - 2028
wave_2['wave'] = 2wave_2.shape(1636, 4)wave_3 = parse_pdf_table('77-128') # 2029 - 2032
wave_3['wave'] = 3wave_3.shape(1809, 4)unknown = parse_pdf_table('129-148')
unknown['wave'] = 0unknown.shape(688, 4) (pandas), df.
df = pd.concat([wave_1, wave_2, wave_3, unknown], ignore_index=True).
df['marker-color'] = df['wave'].map({1:'#0ACF00', #
2:'#1142AA', #
3:'#FFFD00', #
0:'#FD0006'}) # .
df['iconContent'] = df['wave'].map({1:'1',
2:'2',
3:'3',
0:''}).
df['description'] = df['address']— , , , , , . ( ! :)

def add_city(x):
if x['AO'] == '':
return ', ' + x['address']
return ', ' + x['address']df['address'] = df[['AO', 'address']].apply(add_city, axis=1)def geocoder(addr, key=' '):
url = 'https://geocode-maps.yandex.ru/1.x'
params = {'format':'json', 'apikey': key, 'geocode': addr}
response = requests.get(url, params=params)
try:
coordinates = response.json()["response"]["GeoObjectCollection"]["featureMember"][0]["GeoObject"]["Point"]["pos"]
lon, lat = coordinates.split(' ')
except:
lon, lat = 0, 0
return lon, lat%%time
df['longitude'], df['latitude'] = zip(*df['address'].apply(geocoder))CPU times: user 2min 11s, sys: 4.31 s, total: 2min 15s
Wall time: 15min 14s( , .. , ), - - .
len(df[df['longitude'] == 0])0.
df.to_csv('waves.csv')#df = pd.read_csv('waves.csv')def df_to_geojson(df, properties, lat='latitude', lon='longitude'):
geojson = {'type':'FeatureCollection', 'features':[]}
for _, row in df.iterrows():
feature = {'type':'Feature',
'properties':{},
'geometry':{'type':'Point',
'coordinates':[]}}
feature['geometry']['coordinates'] = [row[lon],row[lat]]
for prop in properties:
feature['properties'][prop] = row[prop]
geojson['features'].append(feature)
return geojson.. , , .
properties = ['marker-color', 'iconContent', 'description']
if not os.path.exists('data'):
os.makedirs('data')
for ao, data in df.groupby('AO'):
geojson = df_to_geojson(data, properties)
with open('data/' + ao + '.geojson', 'w') as f:
json.dump(geojson, f, indent=2) .geojson data. _.geojson .
geojson = df_to_geojson(df, properties)
with open('data/_.geojson', 'w') as f:
json.dump(geojson, f, indent=2) 

, , , , — (.), .1 - — . (. , .), .8//. ( , )
, :(
, . , , , , , , , . 39, , . 6, — , . 1, 2, 3, . 38.
— !

- , , . , PbIXTOP, .
2.0
import pandas as pd
import numpy as np
import json
from tabula import read_pdf
from tqdm.notebook import tqdm
import os
with open('renovation_address.txt') as f:
bounded_addresses = json.load(f)def parse_pdf_table(pages, pdf_file='prikaz_grafikpereseleniya.pdf'):
df = read_pdf(pdf_file, pages=pages, pandas_options={'header':None})
#
df = df[~(df.iloc[:,0] == 'No /')]
df['unom'] = df.iloc[:,-1].combine_first(df.iloc[:,-2])
#
df = df.iloc[:,[1, 2, 3, -1]]
df.columns = ['AO', 'district', 'description', 'unom']
return dfwave_1 = parse_pdf_table('3-29') # 2020 - 2024
wave_1['wave'] = 1
wave_2 = parse_pdf_table('30-76') # 2025 - 2028
wave_2['wave'] = 2
wave_3 = parse_pdf_table('77-128') # 2029 - 2032
wave_3['wave'] = 3
unknown = parse_pdf_table('129-148')
unknown['wave'] = 0df = pd.concat([wave_1, wave_2, wave_3, unknown], ignore_index=True)df['marker-color'] = df['wave'].map({1:'#0ACF00', #
2:'#1142AA', #
3:'#FFFD00', #
0:'#FD0006'}) #
df['iconContent'] = df['wave'].map({1:'1',
                                    2:'2',
                                    3:'3',
0:''})df['longitude'] = 0
df['latitude'] = 0for i in tqdm(bounded_addresses):
unom = i['unom']
coordinates = i['center']['coordinates']
df.loc[df['unom']==unom, 'longitude'] = coordinates[1]
df.loc[df['unom']==unom, 'latitude'] = coordinates[0]HBox(children=(FloatProgress(value=0.0, max=5152.0), HTML(value='')))# , ..
df.loc[(df['AO'] == '') | (df['AO'] == ''), 'AO'] = ''df[df['longitude'] == 0]| AO | district | description | unom | wave | marker-color | iconContent | longitude | latitude | |
|---|---|---|---|---|---|---|---|---|---|
| 917 | - | . (.-), .11 | 15000016 | 1 | #0ACF00 | 1 | 0.0 | 0.0 | |
| 918 | - | . (.-), .13 | 15000015 | 1 | #0ACF00 | 1 | 0.0 | 0.0 | |
| 919 | - | . (.-), .3 | 15000013 | 1 | #0ACF00 | 1 | 0.0 | 0.0 | |
| 925 | - | . (.-), .4 | 15000012 | 1 | #0ACF00 | 1 | 0.0 | 0.0 | |
| 926 | - | . (.-), .6 | 15000014 | 1 | #0ACF00 | 1 | 0.0 | 0.0 | |
| 4883 | . (. , .)... | 4405823 | 0 | #FD0006 | 0.0 | 0.0 | |||
| 4945 | . (., /), .51 | 20000002 | 0 | #FD0006 | 0.0 | 0.0 | |||
| 4946 | . (., /), .52 | 20000003 | 0 | #FD0006 | 0.0 | 0.0 | |||
| 4947 | . (., /), .53 | 20000001 | 0 | #FD0006 | 0.0 | 0.0 | |||
| 4948 | . (., /), .85 | 20000000 | 0 | #FD0006 | 0.0 | 0.0 | |||
| 4995 | (.), .1 | 20000004 | 0 | #FD0006 | 0.0 | 0.0 |
,
df.loc[917, ['longitude', 'latitude']] = 37.204805, 55.385382
df.loc[918, ['longitude', 'latitude']] = 37.205255, 55.385367
df.loc[919, ['longitude', 'latitude']] = 37.201518, 55.385265
df.loc[925, ['longitude', 'latitude']] = 37.201545, 55.384927
df.loc[926, ['longitude', 'latitude']] = 37.204151, 55.384576
df.loc[4883, ['longitude', 'latitude']] = 37.321218, 55.661308
df.loc[4945, ['longitude', 'latitude']] = 37.476896, 55.604153
df.loc[4946, ['longitude', 'latitude']] = 37.477406, 55.603895
df.loc[4947, ['longitude', 'latitude']] = 37.476546, 55.602729
df.loc[4948, ['longitude', 'latitude']] = 37.477568, 55.604659
df.loc[4995, ['longitude', 'latitude']] = 37.176806, 55.341541
with open('start_area.txt') as f:
end = json.load(f)data = {
'AO':[],
'district':[],
'longitude':[],
'latitude':[],
'description':[]
}
for i in end['response']:
data['AO'].append(i['OKRUG'])
data['district'] = i['AREA']
coordinates = i['geoData']['coordinates']
data['longitude'].append(coordinates[1])
data['latitude'].append(coordinates[0])
description = i['Address']
if 'StartOfRelocation' in i:
if i['StartOfRelocation'] is not None:
description += '\n' + i['StartOfRelocation']
data['description'].append(description)
df_start_area = pd.DataFrame(data)
df_start_area['marker-color'] = '#7D3E00' #
df_start_area['iconContent'] = '0'
df_start_area['unom'] = None
df_start_area['wave'] = -1
df = pd.concat([df, df_start_area], ignore_index=True)
def df_to_geojson(df, properties, lat='latitude', lon='longitude'):
    geojson = {'type':'FeatureCollection', 'features':[]}
    for _, row in df.iterrows():
        feature = {'type':'Feature',
                   'properties':{},
                   'geometry':{'type':'Point',
                               'coordinates':[]}}
        feature['geometry']['coordinates'] = [row[lon],row[lat]]
        for prop in properties:
            feature['properties'][prop] = row[prop]
        geojson['features'].append(feature)
return geojsonproperties = ['marker-color', 'iconContent', 'description'].
if not os.path.exists('data'):
os.makedirs('data')
for ao, data in df.groupby('AO'):
geojson = df_to_geojson(data, properties)
with open('data/' + ao + '.geojson', 'w') as f:
json.dump(geojson, f, indent=2) ( )
geojson = df_to_geojson(df, properties)

with open('data/_.geojson', 'w') as f:
json.dump(geojson, f, indent=2) , , , , , , , .
UPD 28 2020
.
PbIXTOP , .
UPD 1 2020
Ajout du code réel pour générer la carte, masqué l'implémentation, car la plupart des lecteurs de l'article ne s'intéressent qu'à la carte.
Merci de votre attention.