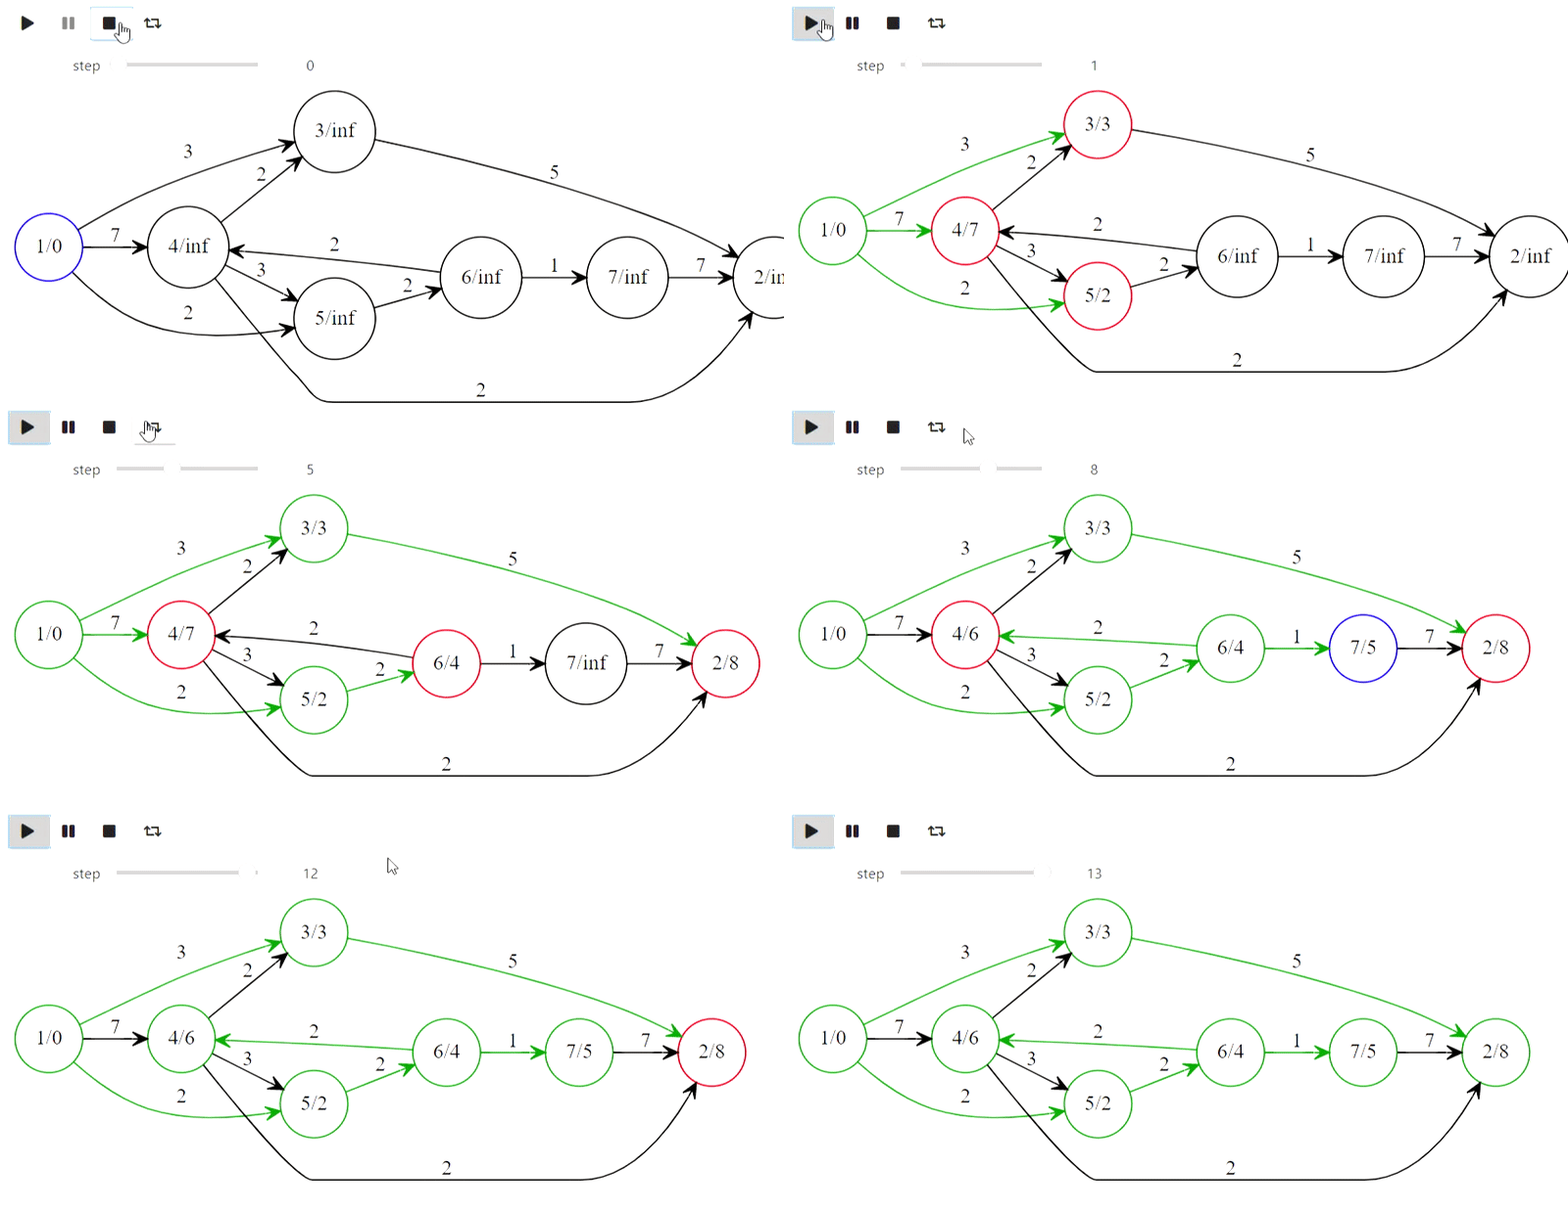
Préface
Tous les exemples qui seront présentés dans l'article se trouvent dans ce cahier , le matériel principal sera caché sous les spoilers en raison du fait qu'il y a beaucoup de code et de gifs. Pour reproduire certains des exemples qui seront présentés dans tous les cas, vous aurez besoin de ce référentiel car il contient des utilitaires intermédiaires.
Comment animer
Sous Jupyter, il existe un ensemble de widgets ( ipywidgets ), qui sont différents types d'outils de gestion, interagissant avec le module IPython.display pour fournir une visualisation interactive. Le code suivant représente toutes les interactions des widgets clés qui peuvent être utilisées pour animer de manière interactive le contenu d'une liste:
from ipywidgets import interact, interactive, fixed, interact_manual
import ipywidgets as widgets
from IPython.display import display


def step_slice(lst, step):
    return lst[step]


def animate_list(lst, play=False, interval=200):
    slider = widgets.IntSlider(min=0, max=len(lst) - 1, step=1, value=0)
    if play:
        play_widjet = widgets.Play(interval=interval)
        widgets.jslink((play_widjet, 'value'), (slider, 'value'))
        display(play_widjet)
        # slider = widgets.Box([play_widject, slider])
    return interact(step_slice,
                    lst=fixed(lst),
                    step=slider)
Voici ce que vous obtenez si vous alimentez la fonction animate_list avec une liste d'entiers:
a = [10, 9, 8, 7, 6, 5, 4, 3, 2, 1]
animate_list(a, play=True, interval=200);
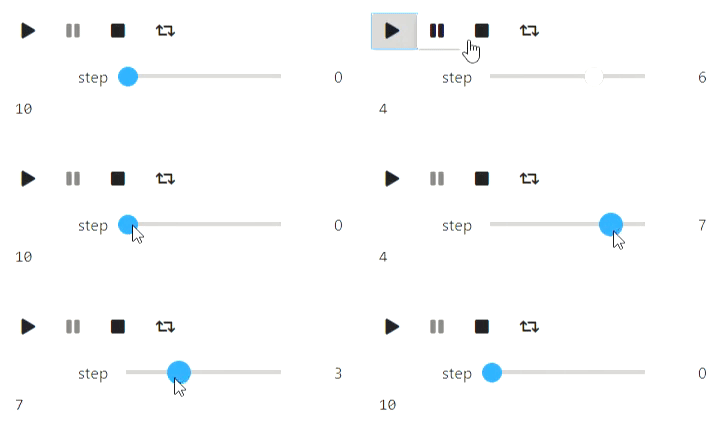
Pour démontrer le fonctionnement d'un algorithme à l'aide de animate_list, vous devez générer des états intermédiaires de l'algorithme et enregistrer leur représentation visuelle au format souhaité.
Animations de texte
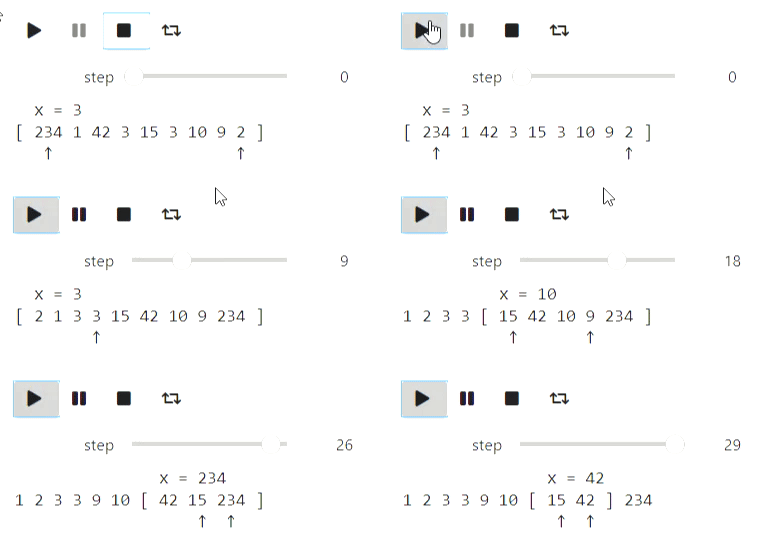
Les algorithmes de base pour travailler avec des séquences / tableaux sont une représentation textuelle suffisante. J'ai malheureusement eu des problèmes avec les chaînes de base qui refusaient de gérer les sauts de ligne, j'ai donc utilisé IPython.display.Code. Commençons par le tri rapide classique.
Le code
from IPython.display import Code
import random

def qsort_state(array, left, right, x, p, q):
    extended_array = list(map(str, array[:left])) + ['['] + list(map(str, array[left: right])) + [']'] + list(map(str, array[right:]))
    offset_x = sum(list(map(len, extended_array[:left]))) + left + 2
    zero_line = ''.join([' ' for i in range(offset_x)]) + f'x = {x}'
    first_line = ' '.join(extended_array)
    offset_p = sum(list(map(len, extended_array[:p + 1]))) + p + 1 + len(extended_array[p + 1]) // 2
    offset_q = sum(list(map(len, extended_array[:q + 1]))) + q + 1 + len(extended_array[q + 1]) // 2
    second_line = ''.join([' ' if i != offset_p and i != offset_q else '↑' for i in range(len(first_line))])

    return Code(zero_line + '\n' + first_line + '\n' + second_line)

def qsort(array, left, right, states):
    if right - left <= 1:
        return
    x = array[random.randint(left, right - 1)]
    p = left
    q = right - 1
    states.append(qsort_state(array, left, right, x, p, q))
    while p <= q:
        while array[p] < x:
            p += 1
            states.append(qsort_state(array, left, right, x, p, q))
        while array[q] > x:
            q -= 1
            states.append(qsort_state(array, left, right, x, p, q))
        if p <= q:
            array[p], array[q] = (array[q], array[p])
            states.append(qsort_state(array, left, right, x, p, q))
            p += 1
            q -= 1
            if p <= q:
                states.append(qsort_state(array, left, right, x, p, q))
    qsort(array, left, q + 1, states)
    qsort(array, p, right, states)
a = [234, 1, 42, 3, 15, 3, 10, 9, 2]
states = []
qsort(a, 0, len(a), states)
animate_list(states, play=True);
Résultat

La recherche binaire peut être visualisée de la même manière.
Le code
def bs_state(array, left, right, x):
    extended_array = list(map(str, array[:left])) + ['['] + list(map(str, array[left: right])) + [']'] + list(map(str, array[right:]))
    mid = (left + right) // 2
    offset_x = sum(list(map(len, extended_array[:mid + 1]))) + mid + 1
    return Code(' '.join(extended_array) + '\n' + ''.join([' ' for i in range(offset_x)]) + str(x))

#       ,
#
states = []
left = 0
right = len(a)
x = 14
while right - left > 1:
    states.append(bs_state(a, left, right, x))
    mid = (left + right) // 2
    if a[mid] <= x:
        left = mid
    else:
        right = mid
states.append(bs_state(a, left, right, x))

animate_list(states, play=True, interval=400);
Résultat
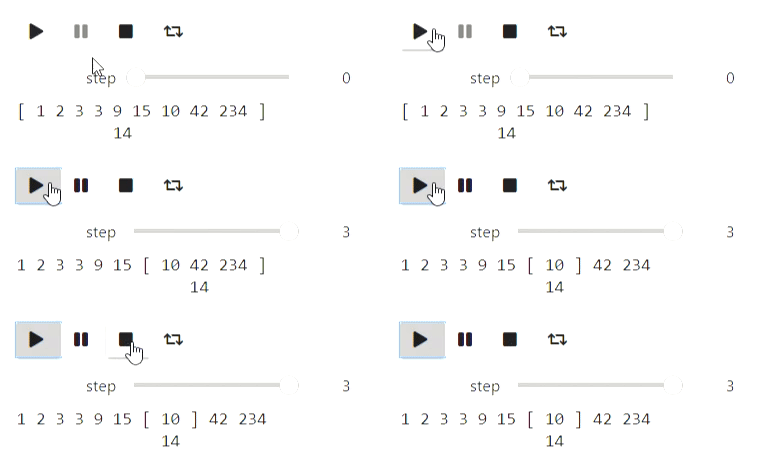

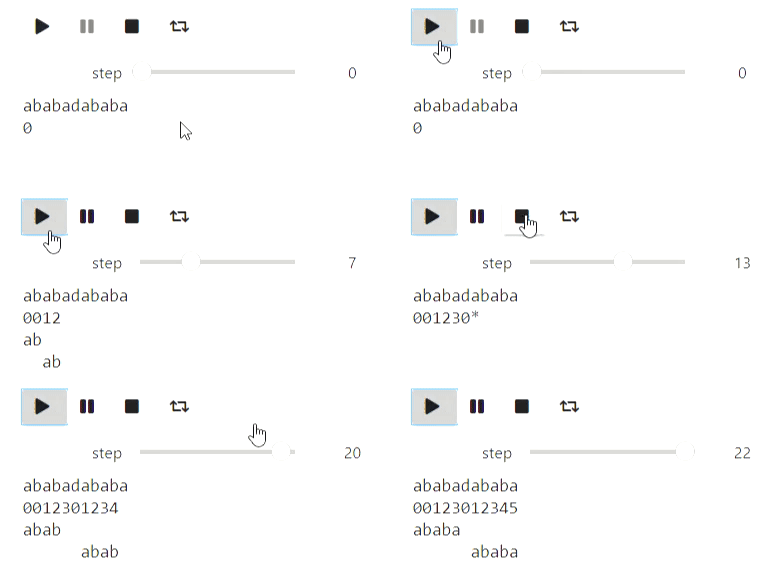
Et voici un exemple pour les chaînes: le processus de construction d'une fonction de préfixe:
Le code
def prefix_function_state(s, p, k, intermidiate=False):
    third_string = ''.join([s[i] if i < k else ' ' for i in range(len(p))])
    fourth_string = ''.join([s[i] if i >= len(p) - k else ' ' for i in range(len(p))])
    return Code(s + '\n' + ''.join(list(map(str, (p + ['*'] if intermidiate else p )))) \
                  + '\n' + third_string + '\n' + fourth_string)

def prefix_function(s, states):
    p = [0]
    k = 0
    states.append(prefix_function_state(s, p, k))
    for letter in s[1:]:
        states.append(prefix_function_state(s, p, k, True))
        while k > 0 and s[k] != letter:
            k = p[k - 1]
            states.append(prefix_function_state(s, p, k, True))
        if s[k] == letter:
            k += 1
        p.append(k)
        states.append(prefix_function_state(s, p, k))
    return p

states = []
p = prefix_function('ababadababa', states)
animate_list(states, play=True);
Résultat

Visualisation à l'aide de Matplotlib
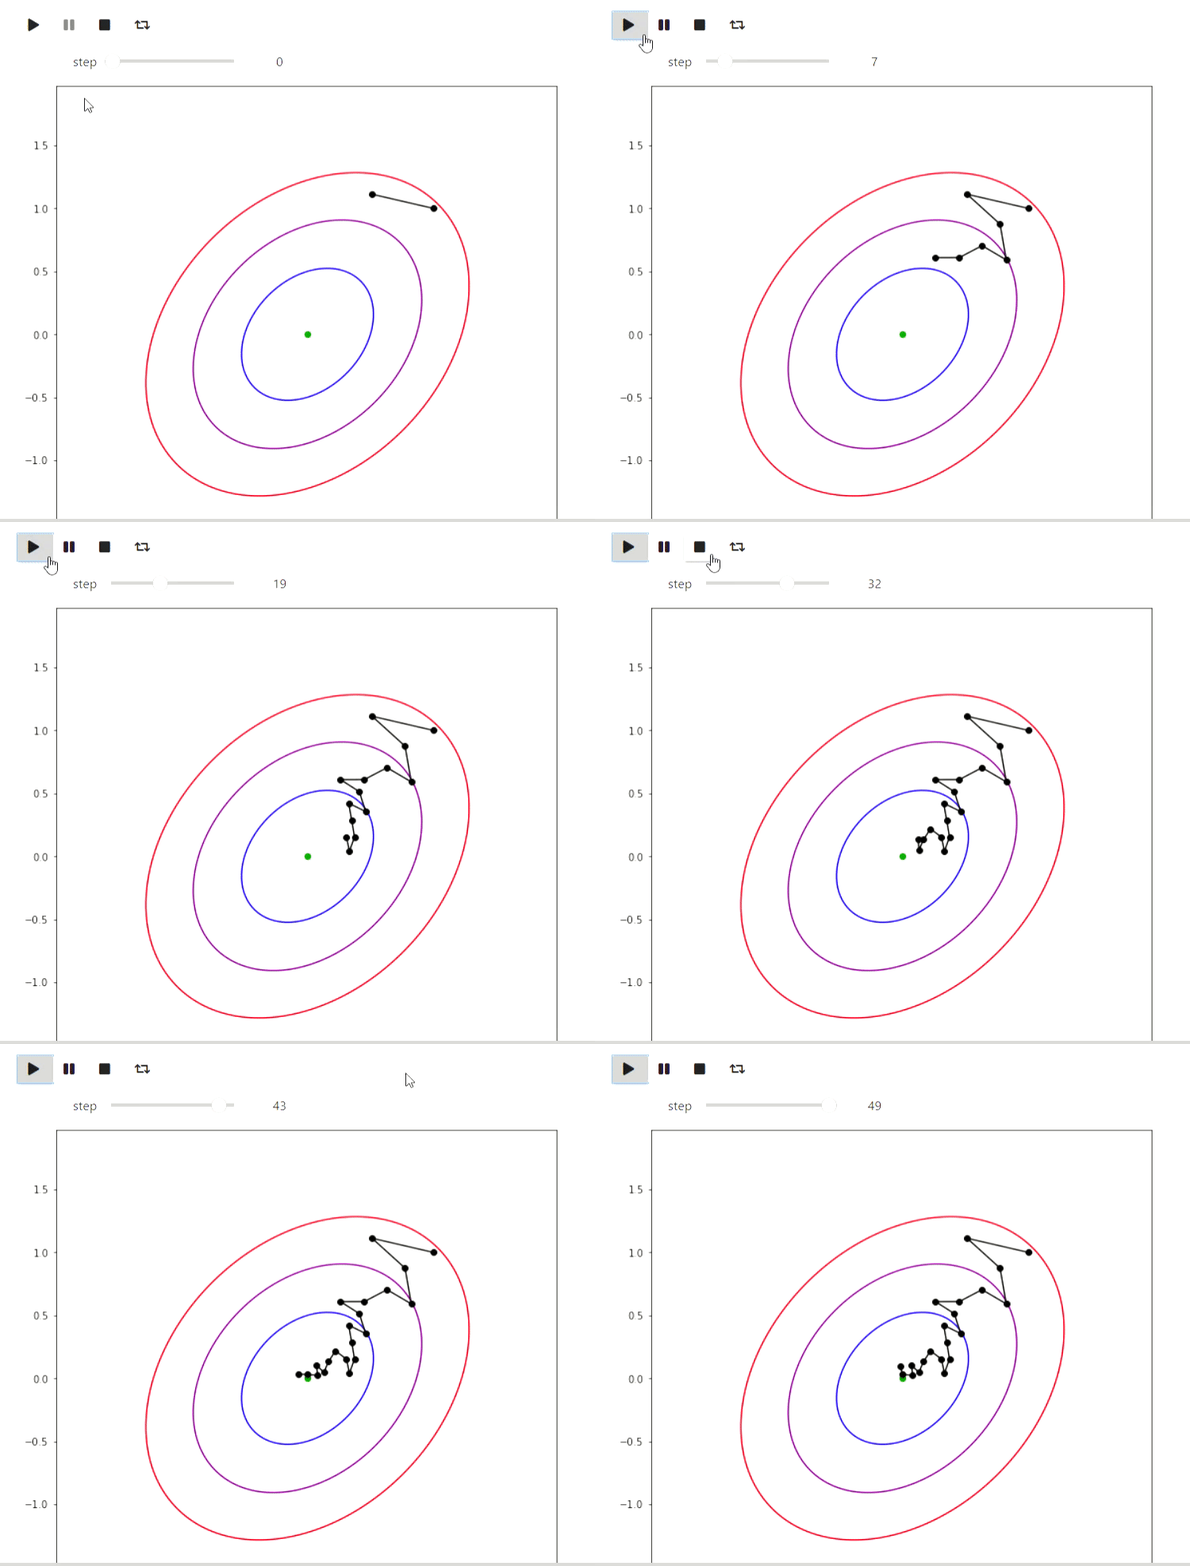
Matplotlib est une bibliothèque Python pour dessiner divers graphiques. Voici quelques exemples de la façon dont vous pouvez l'utiliser pour visualiser des algorithmes. Commençons par un exemple d'algorithmes itératifs pour trouver le minimum d'une fonction, dont le plus simple est la méthode de recherche locale aléatoire, qui modifie localement l'approximation actuelle et y entre si la valeur de la valeur de la fonction au nouveau point s'avère meilleure:
Le code
import numpy as np
import matplotlib.pyplot as plt

# ,  ,    (0, 0)
def f(x, y):
    return 1.3 * (x - y) ** 2 + 0.7 * (x + y) ** 2

#
def plot_trajectory(func, traj, limit_point=None):
    fig = plt.figure(figsize=(7, 7))
    ax = fig.add_axes([0, 0, 1, 1])

    if limit_point:
        ax.plot([limit_point[0]], [limit_point[1]], 'o', color='green')
    #Level contours
    delta = 0.025
    x = np.arange(-2, 2, delta)
    y = np.arange(-2, 2, delta)
    X, Y = np.meshgrid(x, y)
    Z = np.zeros_like(X)
    for i in range(X.shape[0]):
        for j in range(X.shape[1]):
            Z[i][j] = func(X[i][j], Y[i][j])
    CS = ax.contour(X, Y, Z, [0.5, 1.5, 3], colors=['blue', 'purple', 'red'])
    ax.plot([u[0] for u in traj], [u[1] for u in traj], color='black')
    ax.plot([u[0] for u in traj], [u[1] for u in traj], 'o', color='black')

    plt.close(fig)
    return fig

x, y = (1.0, 1.0)
num_iters = 50
trajectory = [(x, y)]
plots = []
#
for i in range(num_iters):
    angle = 2 * np.pi * np.random.rand(1)
    dx, dy = (np.cos(angle) / 2 / (i + 1) ** 0.5, np.sin(angle) / 2 / (i + 1) ** 0.5)
    trajectory.append((x + dx, y + dy))
    plots.append(plot_trajectory(f, trajectory, limit_point=(0, 0)))
    if f(x, y) > f(x + dx, y + dy):
        x = x + dx
        y = y + dy
    else:
        trajectory = trajectory[:-1]

animate_list(plots, play=True, interval=300);
Résultat

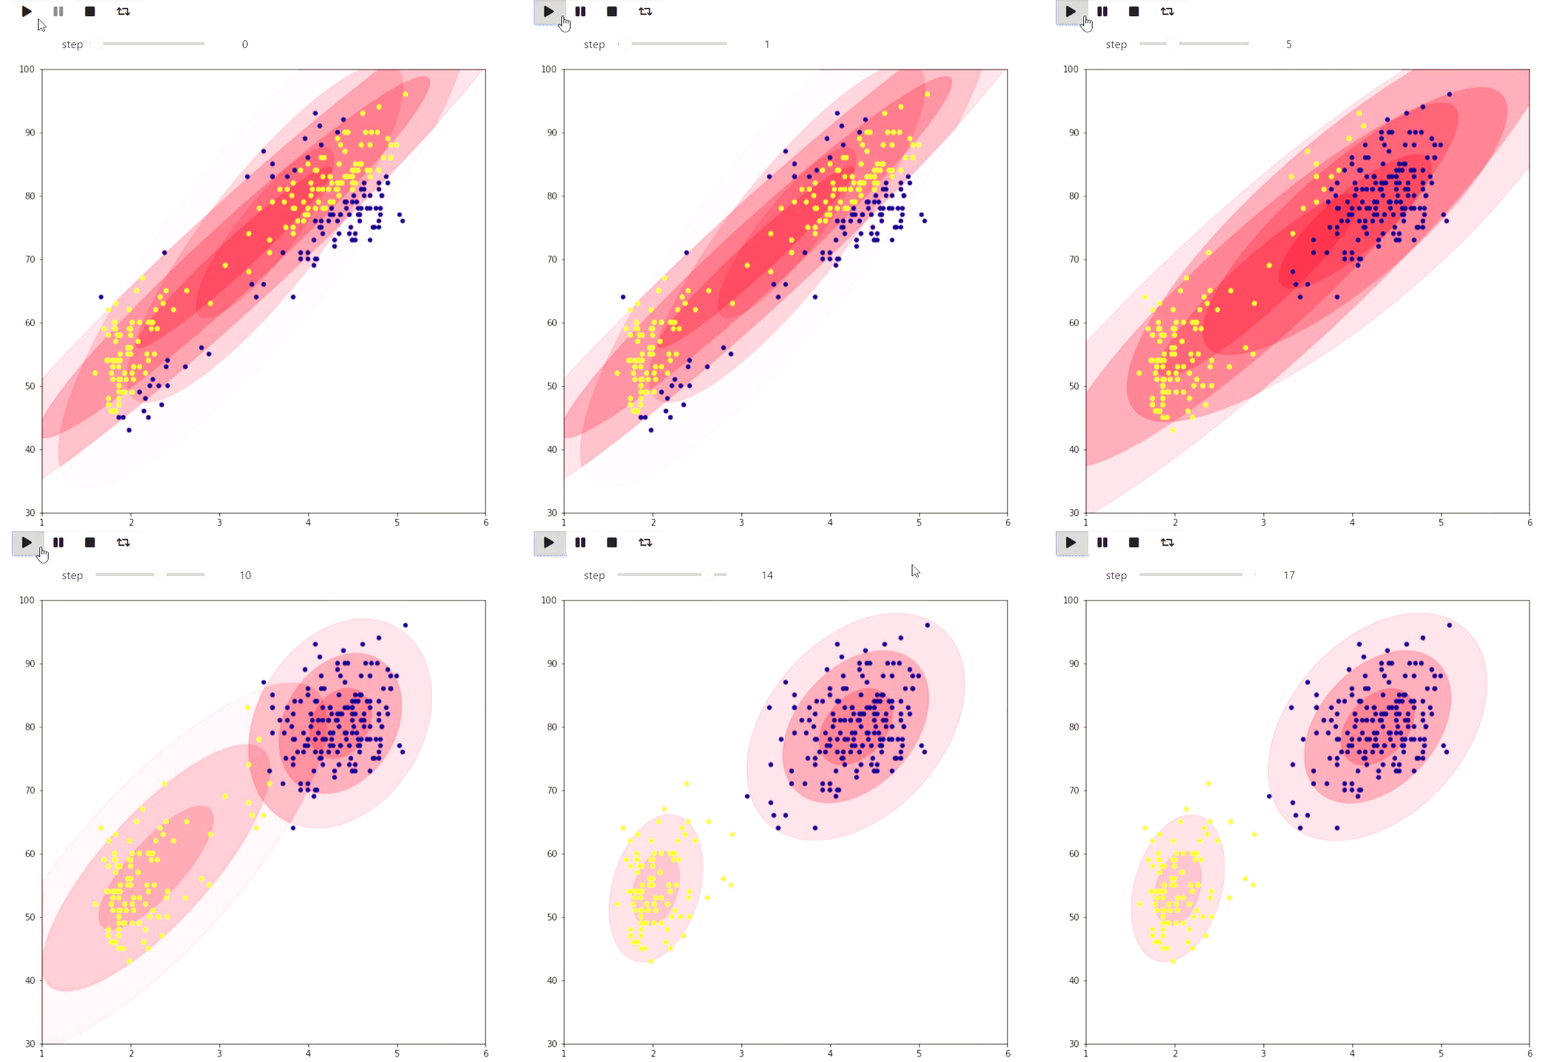
Et voici un exemple de l'algorithme EM pour les données des éruptions d'un geyser Old Faithful, le même exemple est donné sur Wikipedia :
Le code
#
# http://www.stat.cmu.edu/~larry/all-of-statistics/=data/faithful.dat
data = []
with open('data/faithful.csv') as f:
    for line in f:
        _, x, y = line.split(',')
        try:
            data.append((float(x), float(y)))
        except ValueError:
            pass

colors = ['red', 'blue', 'yellow', 'green']

#    https://jakevdp.github.io/PythonDataScienceHandbook/05.12-gaussian-mixtures.html
from matplotlib.patches import Ellipse

def draw_ellipse(position, covariance, ax=None, **kwargs):
    """Draw an ellipse with a given position and covariance"""
    ax = ax or plt.gca()

    # Convert covariance to principal axes
    if covariance.shape == (2, 2):
        U, s, Vt = np.linalg.svd(covariance)
        angle = np.degrees(np.arctan2(U[1, 0], U[0, 0]))
        width, height = 2 * np.sqrt(s)
    else:
        angle = 0
        width, height = 2 * np.sqrt(covariance)

    # Draw the Ellipse
    for nsig in range(1, 4):
        ax.add_patch(Ellipse(position, nsig * width, nsig * height,
                             angle, color='red', **kwargs))

def plot_gmm(gmm, X, label=True, ax=None):
    ax = ax or plt.gca()
    if label:
        labels = gmm.predict(X)
        ax.scatter(X[:, 0], X[:, 1], c=labels, s=20, cmap='plasma', zorder=2)
    else:
        ax.scatter(X[:, 0], X[:, 1], s=20, zorder=2)

    w_factor = 0.2 / gmm.weights_.max()
    for pos, covar, w in zip(gmm.means_, gmm.covariances_, gmm.weights_):
        draw_ellipse(pos, covar, alpha=w * w_factor)

def step_figure(gmm, X, label=True):
    fig = plt.figure(figsize=(7, 7))
    ax = fig.add_axes([0, 0, 1, 1])
    ax.set_ylim(30, 100)
    ax.set_xlim(1, 6)
    plot_gmm(gmm, X, label=True, ax=ax)
    plt.close(fig)
    return fig

from sklearn.mixture import GaussianMixture

x = np.array(data)
# max_iters=1  warm_start=True  gmm.fit
#
gmm = GaussianMixture(2, warm_start=True, init_params='random', max_iter=1)
# GMM    ,
import warnings
warnings.simplefilter('ignore')
#
gmm.fit(x[:10,:])
steps = [step_figure(gmm, x)]
for i in range(17):
    gmm.fit(x)
    steps.append(step_figure(gmm, x))

animate_list(steps, play=True, interval=400);
Résultat

L'exemple suivant est plutôt jouet, mais montre aussi ce qui peut être fait dans matplotlib: visualisation du pavage d'une figure à damier sur un plan avec le nombre maximum de dominos en trouvant le maximum correspondant:
Le code
#   matplotlib   ,
from animation_utils.matplotlib import draw_filling

def check_valid(i, j, n, m, tiling):
    return 0 <= i and i < n and 0 <= j and j < m and tiling[i][j] != '#'

def find_augmenting_path(x, y, n, m, visited, matched, tiling):
    if not check_valid(x, y, n, m, tiling):
        return False
    if (x, y) in visited:
        return False
    visited.add((x, y))

    for dx, dy in [(-1, 0), (1, 0), (0, -1), (0, 1)]:
        if not check_valid(x + dx, y + dy, n, m, tiling):
            continue
        if (x + dx, y + dy) not in matched or find_augmenting_path(*matched[(x + dx , y + dy)], n, m, visited, matched, tiling):
            matched[(x + dx, y + dy)] = (x, y)
            return True
    return False

def convert_match(matched, tiling, n, m):
    result = [[-1 if tiling[i][j] == '#' else -2 for j in range(m)] for i in range(n)]
    num = 0
    for x, y in matched:
        _x, _y = matched[(x, y)]
        result[x][y] = num
        result[_x][_y] = num
        num += 1
    return result

def match_with_flow(tiling):
    result_slices = []
    n = len(tiling)
    m = len(tiling[0])

    matched = dict()
    #
    rows = list(range(n))
    columns = list(range(m))
    random.shuffle(rows)
    random.shuffle(columns)
    result_slices.append(convert_match(matched, tiling, n, m))

    for i in rows:
        for j in columns:
            if (i + j) % 2 == 1:
                continue
            visited = set()
            if find_augmenting_path(i, j, n, m, visited, matched, tiling):
                result_slices.append(convert_match(matched, tiling, n, m))

    return result_slices

tiling_custom=[
    '...####',
    '....###',
    '......#',
    '#.#....',
    '#......',
    '##.....',
    '###...#',
]
sequencial_match = match_with_flow(tiling_custom)
animate_list(list(map(draw_filling, sequencial_match)), play=True);
Résultat
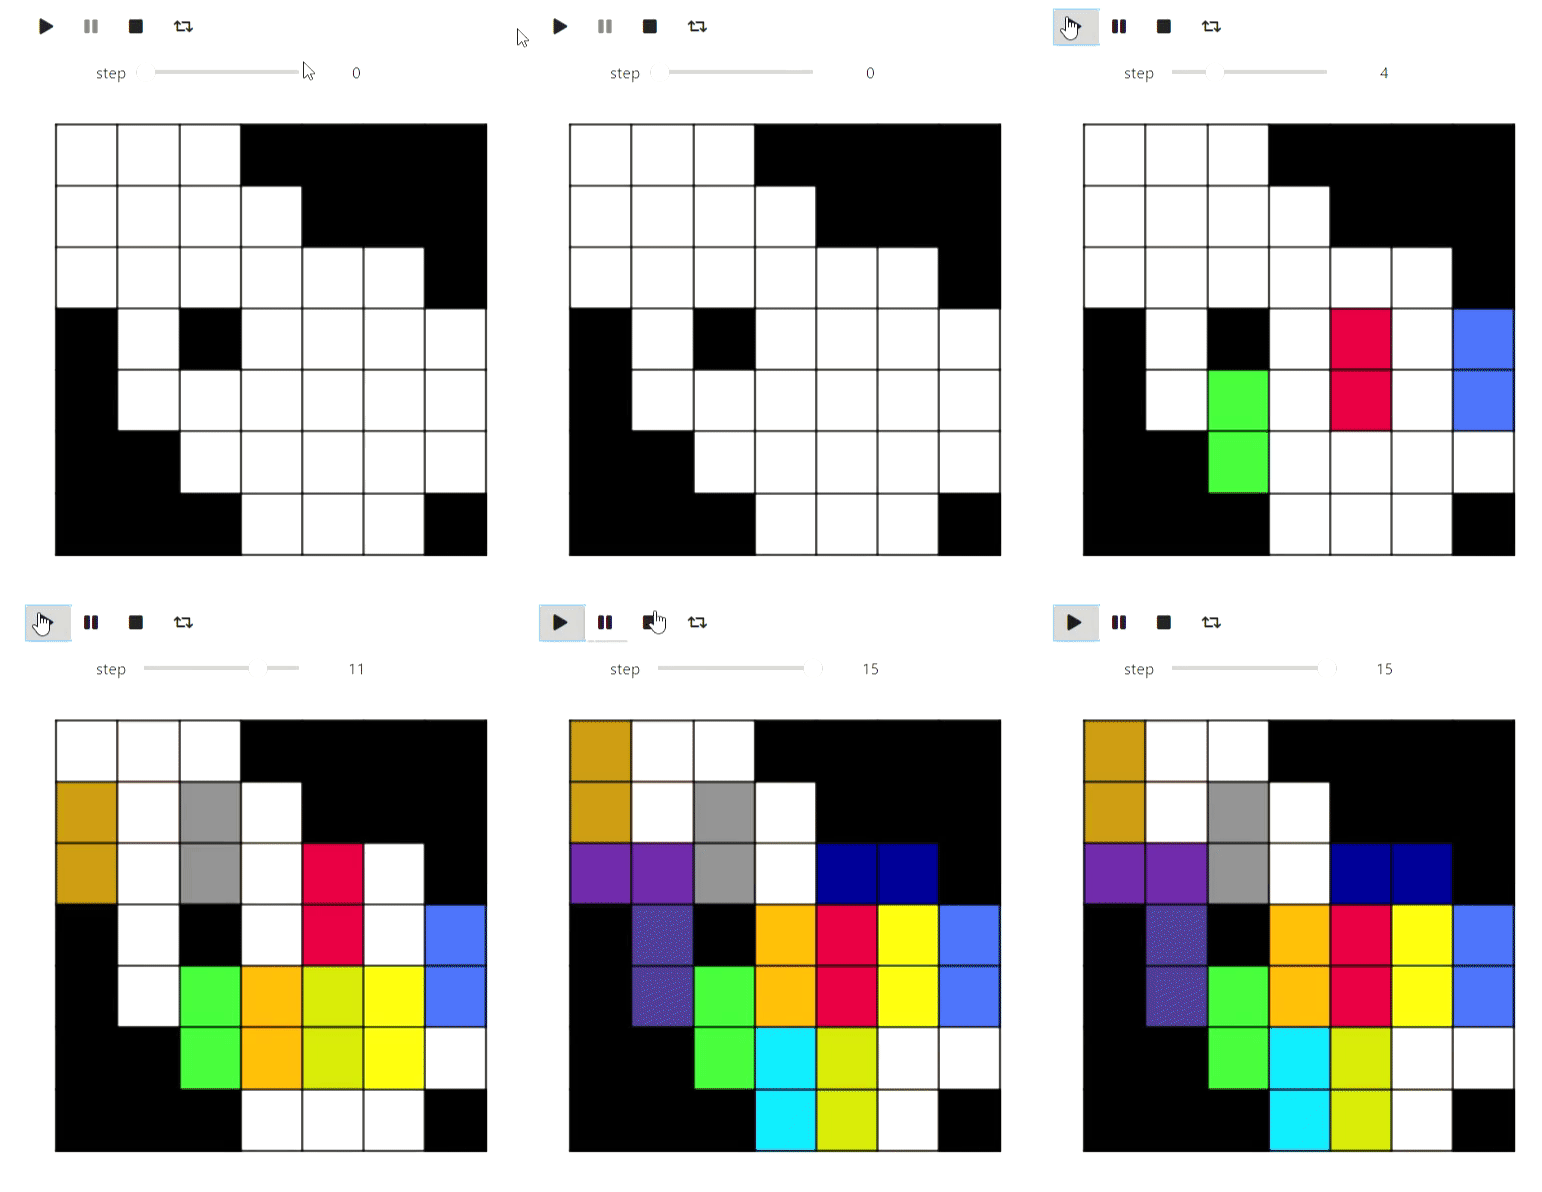

Eh bien, en cours de route, une démonstration de l'algorithme de coloration d'un graphe planaire en 5 couleurs, de sorte que visuellement la partition soit meilleure:
Le code
def color_5(filling):
    result = [[i for i in row] for row in filling]
    #
    domino_tiles = [[] for i in range(max(map(max, filling)) + 1)]
    domino_neighbours = [set() for i in range(max(map(max, filling)) + 1)]
    degree = [0 for i in range(max(map(max, filling)) + 1)]

    n = len(filling)
    m = len(filling[0])

    for i, row in enumerate(filling):
        for j, num in enumerate(row):
            if num >= 0:
                domino_tiles[num].append((i, j))

    for i, tiles in enumerate(domino_tiles):
        for x, y in tiles:
            for dx, dy in [(-1, 0), (1, 0), (0, -1), (0, 1), (-1, -1), (-1, 1), (1, -1), (1, 1)]:
                a, b = x + dx, y + dy
                if 0 <= a and a < n and 0 <= b and b < m and filling[a][b] >= 0 and filling[a][b] != i \
                        and filling[a][b] not in domino_neighbours[i]:
                    domino_neighbours[i].add(filling[a][b])
                    degree[i] += 1

    #       ,      5
    # .     ,   ,
    #           ,
    active_degrees = [set() for i in range(max(degree) + 1)]
    for i, deg in enumerate(degree):
        active_degrees[deg].add(i)

    reversed_order = []

    for step in range(len(domino_tiles)):
        min_degree = min([i for i, dominoes in enumerate(active_degrees) if len(dominoes) > 0])
        domino = active_degrees[min_degree].pop()

        reversed_order.append(domino)
        for other in domino_neighbours[domino]:
            if other in active_degrees[degree[other]]:
                active_degrees[degree[other]].remove(other)
                degree[other] -= 1
                active_degrees[degree[other]].add(other)

    #             ,
    #     5 ,      ,
    #    .
    colors = [-1 for domino in domino_tiles]
    slices = [draw_filling(result)]
    for domino in reversed(reversed_order):
        used_colors = [colors[other] for other in domino_neighbours[domino] if colors[other] != -1]

        domino_color = len(used_colors)
        for i, color in enumerate(sorted(set(used_colors))):
            if i != color:
                domino_color = i
                break

        if domino_color < 5:
            colors[domino] = domino_color
            for x, y in domino_tiles[domino]:
                result[x][y] = domino_color

            slices.append(draw_filling(result))
            continue

        #      ,
        c = 0
        other = [other for other in domino_neighbours[domino] if colors[other] == c]
        visited = set([other])
        q = Queue()
        q.put(other)
        domino_was_reached = False
        while not q.empty():
            cur = q.get()
            for other in domino_neighbours[cur]:
                if other == domino:
                    domino_was_reached = True
                    break
                if color[other] == c or color[other] == c + 1 and other not in visited:
                    visited.add(other)
                    q.put(other)

        if not domino_was_reached:
            for other in visited:
                color[other] = color[other] ^ 1
                for x, y in domino_tiles[other]:
                    result[x][y] = color[other]
            color[domino] = c
            for x, y in domino_tiles[domino]:
                result[x][y] = c

            slices.append(draw_filling(result))
            continue

        #     2  3.
        c = 2
        other = [other for other in domino_neighbours[domino] if colors[other] == c]
        visited = set([other])
        q = Queue()
        q.put(other)
        domino_was_reached = False
        while not q.empty():
            cur = q.get()
            for other in domino_neighbours[cur]:
                if other == domino:
                    domino_was_reached = True
                    break
                if color[other] == c or color[other] == c + 1 and other not in visited:
                    visited.add(other)
                    q.put(other)
        for other in visited:
            color[other] = color[other] ^ 1
            for x, y in domino_tiles[other]:
                result[x][y] = color[other]
        color[domino] = c
        for x, y in domino_tiles[domino]:
            result[x][y] = c
        slices.append(draw_filling(result))

    return result, slices

filling_colored, slices =color_5(sequencial_match[-1])
animate_list(slices, play=True);
Résultat
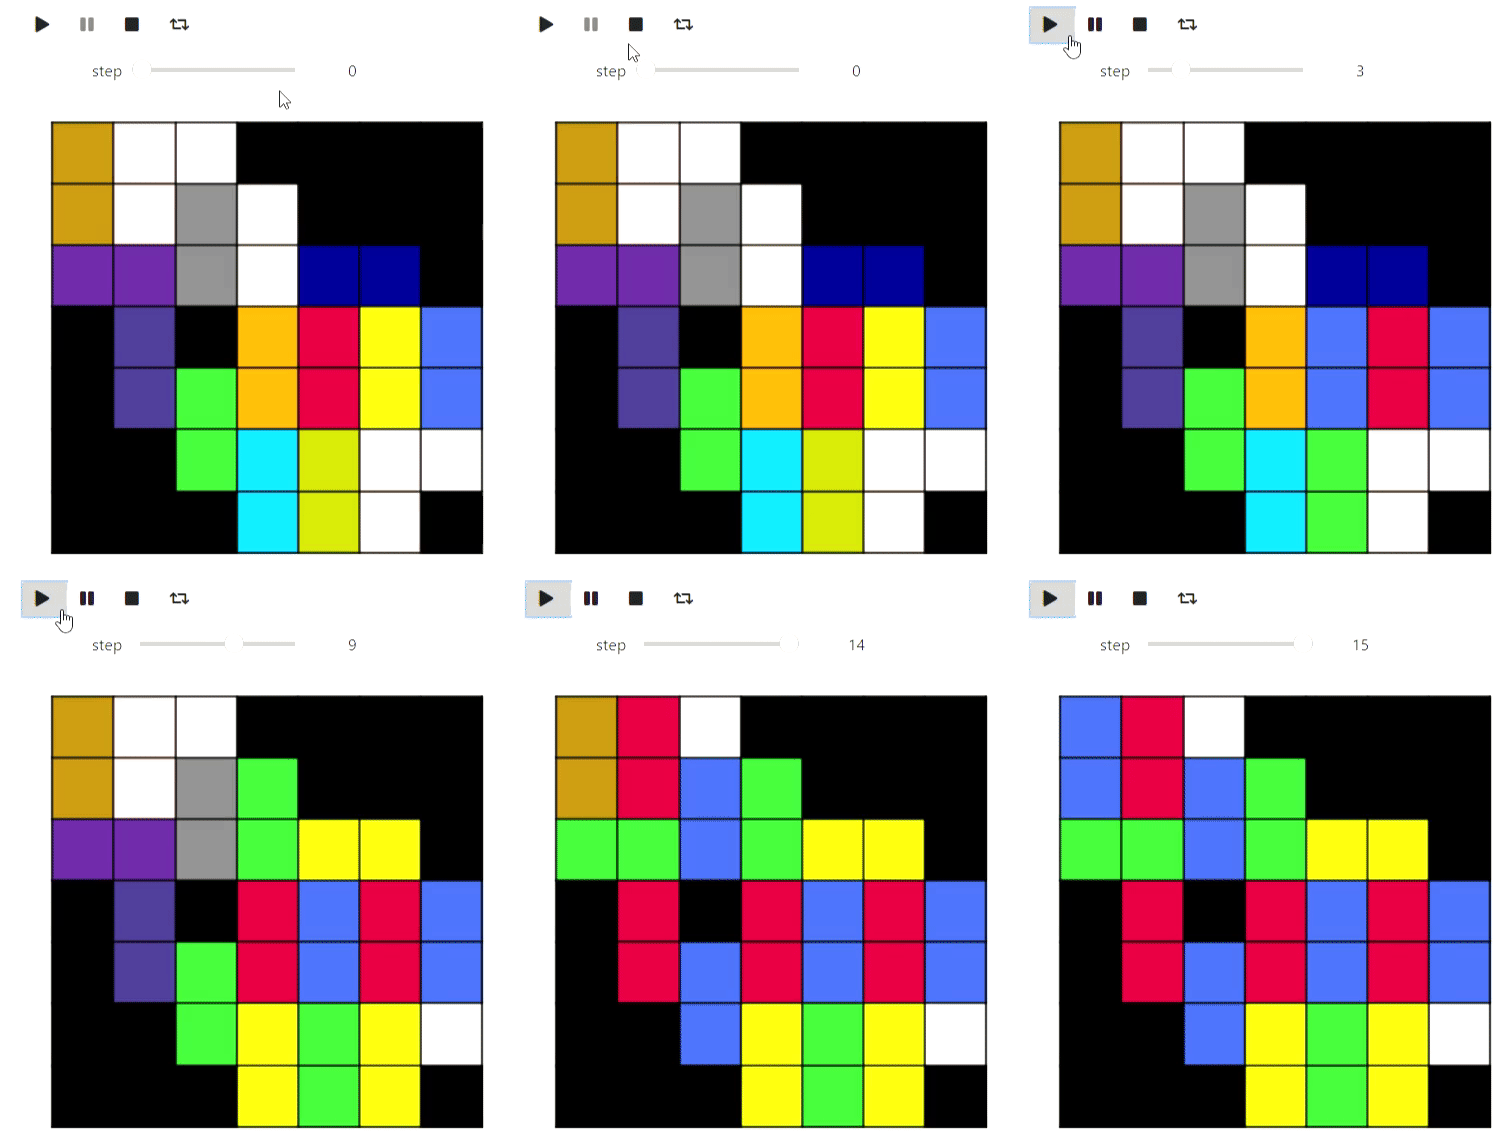

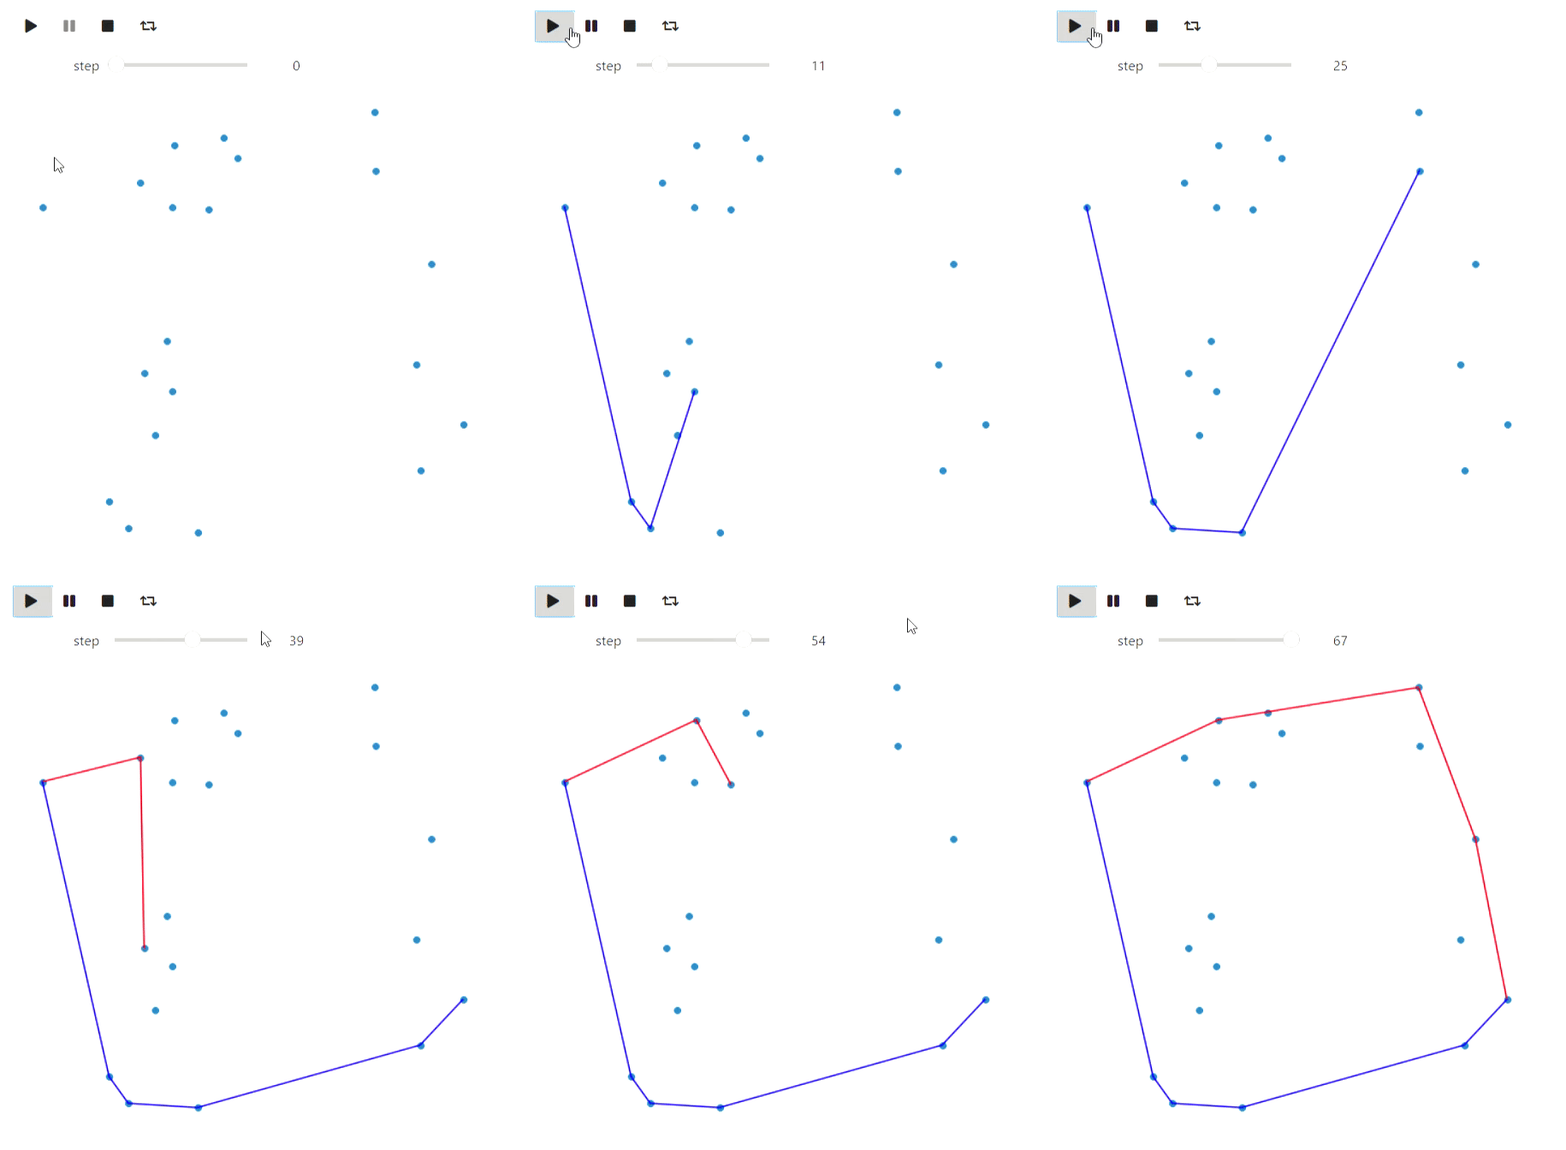
Le dernier exemple avec matplotlib de la géométrie de calcul est l'algorithme de Graham-Andrew pour tracer une coque convexe sur un plan:
Le code
def convex_hull_state(points, lower_path, upper_path):
    fig = plt.figure(figsize=(6, 6))
    ax = fig.add_axes([0, 0, 1, 1])

    ax.get_xaxis().set_visible(False)
    ax.get_yaxis().set_visible(False)

    for name, spine in ax.spines.items():
        spine.set_visible(False)
        spine.set_visible(False)

    ax.scatter([x for x, y in points], [y for x, y in points])
    ax.plot([x for x, _ in lower_path], [y for _, y in lower_path], color='red')
    ax.plot([x for x, _ in upper_path], [y for _, y in upper_path], color='blue')

    plt.close(fig)
    return fig

def vector_prod(point_a, point_b):
    return point_a[0] *  point_b[1] - point_a[1] * point_b[0]

def convex_hull(poitns):
    sorted_points = sorted(points, key=lambda x: x[1])
    sorted_points = sorted(sorted_points, key=lambda x: x[0])
    states = []

    upper_path = [sorted_points[0]]
    lower_path = [sorted_points[0]]
    states.append(convex_hull_state(points, lower_path, upper_path))

    for point in sorted_points[1:]:
        while len(upper_path) > 1 and vector_prod(point - upper_path[-1], upper_path[-1] - upper_path[-2]) > 0:
            upper_path = upper_path[:-1]
            upper_path.append(point)
            states.append(convex_hull_state(poitns, lower_path, upper_path))
            upper_path = upper_path[:-1]
        upper_path.append(point)
        states.append(convex_hull_state(points, lower_path, upper_path))

    for point in sorted_points[1:]:
        while len(lower_path) > 1 and vector_prod(point - lower_path[-1], lower_path[-1] - lower_path[-2]) < 0:
            lower_path = lower_path[:-1]
            lower_path.append(point)
            states.append(convex_hull_state(poitns, lower_path, upper_path))
            lower_path = lower_path[:-1]
        lower_path.append(point)
        states.append(convex_hull_state(poitns, lower_path, upper_path))

    return states

points = [np.random.rand(2) for i in range(20)]
states = convex_hull(points)
animate_list(states, play=True, interval=300);
Résultat

La dernière chose que je voudrais noter dans le contexte de matplotlib est une autre façon de créer des animations via matplotlib.animation.FuncAnimation. Cette méthode a ses avantages: elle peut être convertie en html en utilisant IPython.display.HTML, le résultat sera plus fiable que sur les widgets (mes widgets sont périodiquement ralentis), elle ne nécessitera pas de noyau de travail Jupyter, mais dans ce cas l'animation est normale la vidéo et les commandes sont limitées au lecteur.
Graphviz
Graphviz peut être utilisé pour dessiner des graphiques. Veuillez noter que pour reproduire des exemples en l'utilisant, vous devrez installer graphviz non seulement en python, mais également sur le système . Commençons par une traversée en profondeur:
Le code
#
from graph_utils.graph import Graph, Arc, Node

def enter_node(node):
    node.SetColor('blue')

def enter_arc(node, arc):
    node.SetColor('green')
    arc.attributes['style'] = 'dashed'
    arc.attributes['color'] = 'green'

def return_from_arc(node, arc):
    arc.attributes['style'] = 'solid'
    arc.attributes['color'] = 'red'
    node.SetColor('blue')

def ignore_arc(arc):
    arc.attributes['color'] = 'blue'

def leave_node(node):
    node.SetColor('red')

def dfs(graph, node_id, visited, outlist, path):
    visited.add(node_id)
    path.append(node_id)
    enter_node(graph.nodes[node_id])
    outlist.append(graph.Visualize())
    for arc in graph.nodes[node_id].arcs:
        if arc.end not in visited:
            enter_arc(graph.nodes[node_id], arc)
            dfs(graph, arc.end, visited, outlist, path)
            return_from_arc(graph.nodes[node_id], arc)
            path.append(node_id)
        else:
            ignore_arc(arc)
        outlist.append(graph.Visualize())
    leave_node(graph.nodes[node_id])

arcs = [
    Arc(1, 3, 3),
    Arc(1, 4, 7),
    Arc(4, 3, 2),
    Arc(4, 5, 3),
    Arc(1, 5, 2),
    Arc(6, 4, 2),
    Arc(5, 6, 2),
    Arc(6, 7, 1),
    Arc(7, 2, 7),
    Arc(4, 2, 2),
    Arc(3, 2, 5)
]

#     ,      `dot`,
#      graphviz
# https://graphviz.org/download/
graph = Graph(arcs)
visited = set()
dfs_outlist = []
path = []
dfs_outlist.append(graph.Visualize())
dfs(graph, 1, visited, dfs_outlist, path)
dfs_outlist.append(graph.Visualize())
animate_list(dfs_outlist, play=True, interval=400);
Résultat
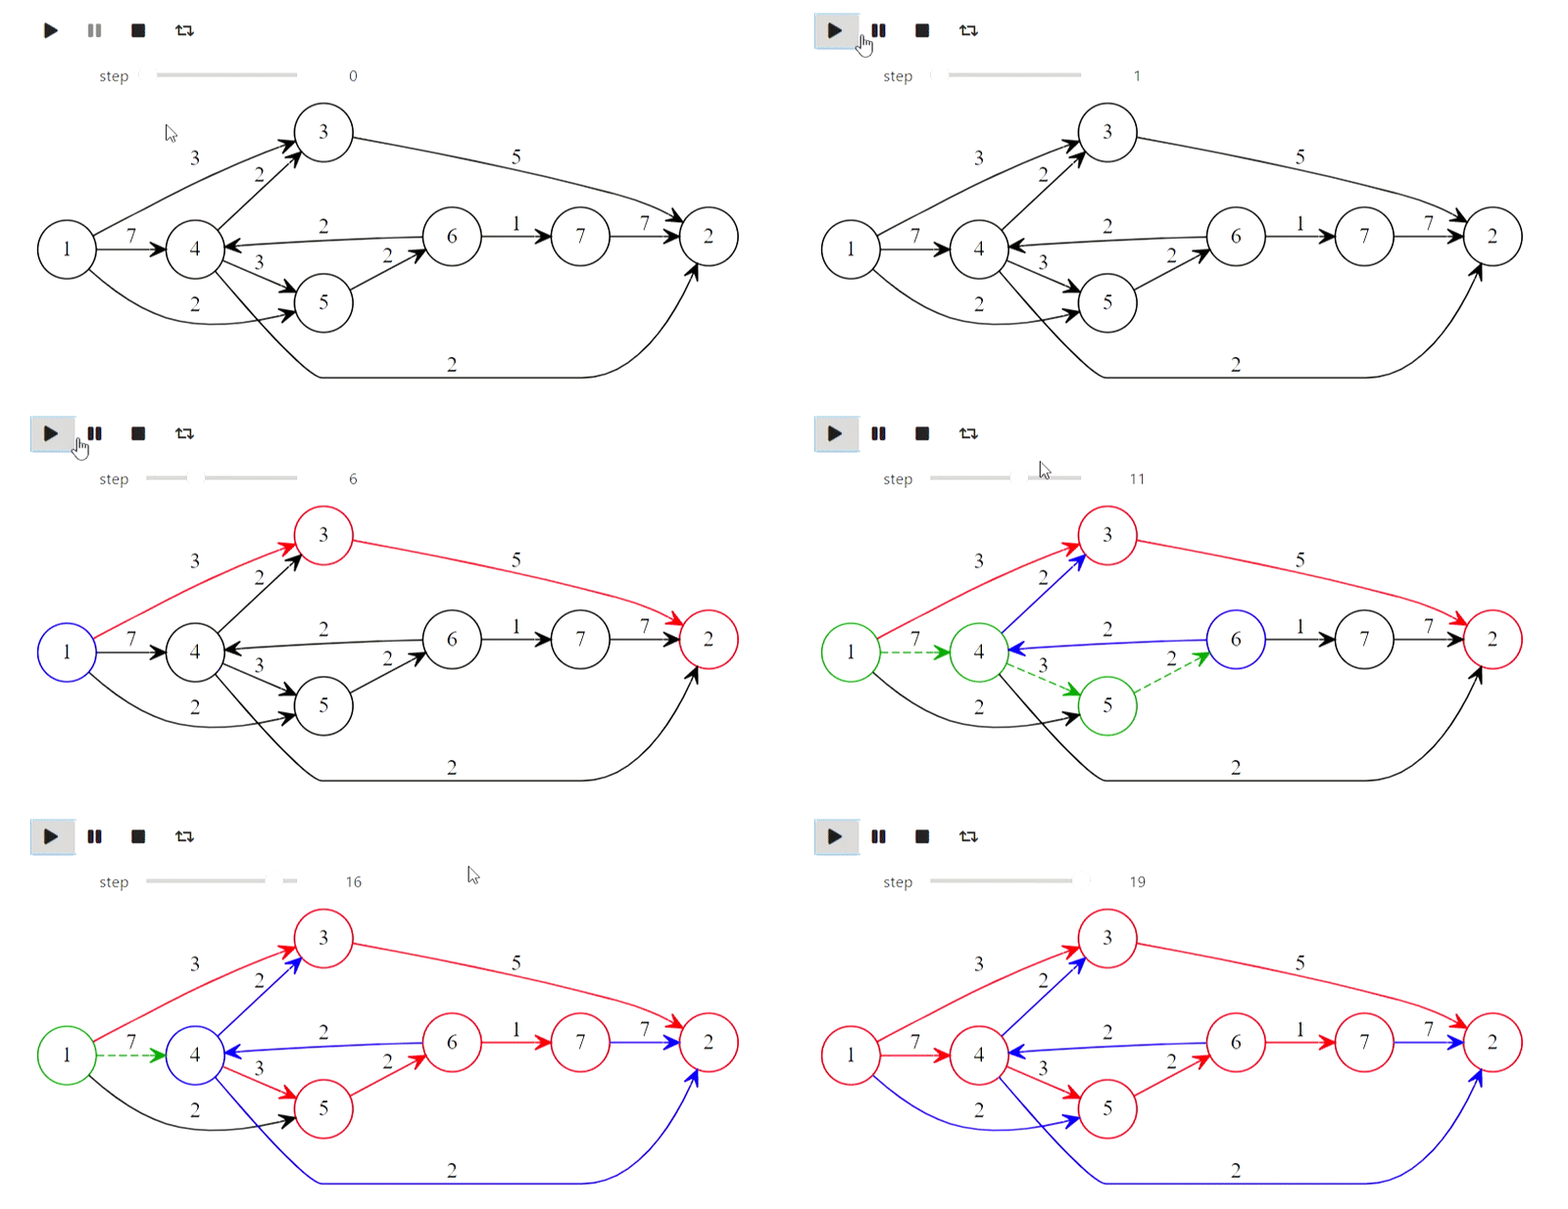

Eh bien, voici l'algorithme de Dijkstra du titre
Le code
def mark_labelled(node):
    node.SetColor('red')

def mark_scanned(node):
    node.SetColor('green')

def process_node(node):
    node.SetColor('blue')

def set_previous(arc):
    arc.SetColor('green')

def unset_previous(arc):
    arc.SetColor('black')

def scan_arc(graph, arc, l, p, mark):
    if l[arc.end] > l[arc.beginning] + arc.weight:
        l[arc.end] = l[arc.beginning] + arc.weight
        if p[arc.end] is not None:
            unset_previous(p[arc.end])
        #  arc,   arc.beginning,
        p[arc.end] = arc
        set_previous(p[arc.end])
        mark[arc.end] = True
        mark_labelled(graph.nodes[arc.end])

def scan_node(graph, node_id, l, p, mark):
    for arc in graph.nodes[node_id].arcs:
        scan_arc(graph, arc, l, p, mark)
    mark[node_id] = False
    mark_scanned(graph.nodes[node_id])


#      ,
#  ,
# http://forskning.diku.dk/PATH05/GoldbergSlides.pdf
def base_scanning_method(graph, s, choice_function):
    l    = {key: float('Inf') for key in graph.nodes.keys()}
    p    = {key: None for key in graph.nodes.keys()}
    mark = {key: False for key in graph.nodes.keys()}

    l[s] = 0
    mark[s] = True
    mark_labelled(graph.nodes[s])

    out_lst = []

    while True:
        node_id = choice_function(l, mark)
        if node_id is None:
            break
        process_node(graph.nodes[node_id])
        out_lst.append(graph.Visualize(l))
        scan_node(graph, node_id, l, p, mark)
        out_lst.append(graph.Visualize(l))
    return l, p, out_lst

#
def least_distance_choice(l, mark):
    labelled = [node_id for node_id, value in mark.items() if value == True]
    if len(labelled) == 0:
        return None
    return min(labelled, key=lambda x: l[x])

graph = Graph(arcs)
l, p, bfs_shortest_path_lst = \
    base_scanning_method(graph, 1, least_distance_choice)
animate_list(bfs_shortest_path_lst, play=True, interval=400);
Résultat


Et voici comment l'arborescence des préfixes des mots 'mère', 'mère', 'singe', 'savon', 'lait' est construite:
Le code
class TrieNode:
    def __init__(self, parent, word=None):
        #     ,
        #
        self.parent = parent
        #  ,
        self.word = word
        self.children = {}
        self.suff_link = None

def init_trie():
    trie = [TrieNode(-1)]
    return trie

def to_graph(trie):
    arcs = []
    for i, node in enumerate(trie):
        for c, nextstate in node.children.items():
            arcs.append(Arc(i, nextstate, c))
        if node.suff_link is not None and node.suff_link != 0:
            arcs.append(Arc(i,
                            node.suff_link,
                            attributes={"constraint" : "False", "style" : "dashed"}))

    return Graph(arcs)

def add_word(trie, word, steps):
    _num = 0
    for ch in word:
        if not ch in trie[_num].children:
            _n = len(trie)
            trie[_num].children[ch] = _n
            trie.append(TrieNode((_num, ch)))
        _num = trie[_num].children[ch]
        graph = to_graph(trie)
        graph.nodes[_num].SetColor('red')
        steps.append(graph.Visualize())
    trie[_num].word = word

def make_trie(words):
    steps = []
    trie = init_trie()
    steps.append(to_graph(trie).Visualize())
    for word in words:
        add_word(trie, word, steps)
        steps.append(to_graph(trie).Visualize())
    return trie, steps

words = [
    '',
    '',
    '',
    '',
    ''
]
trie, steps = make_trie(words)
animate_list(steps, play=True, interval=500);
Résultat
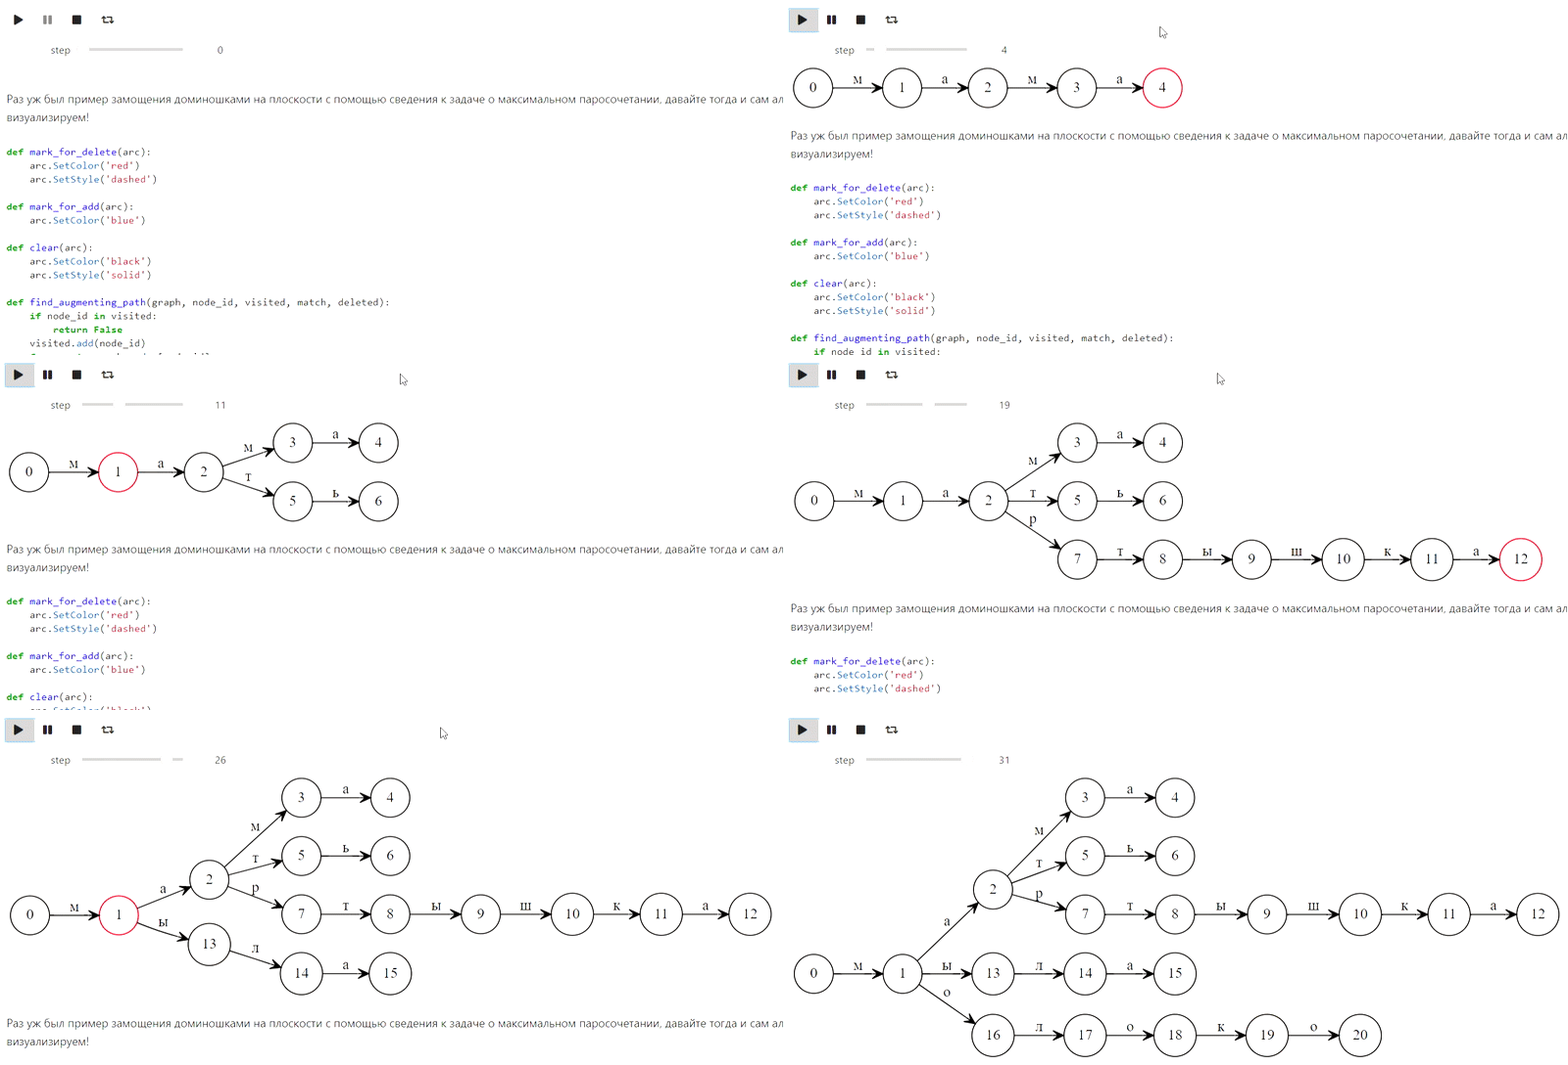

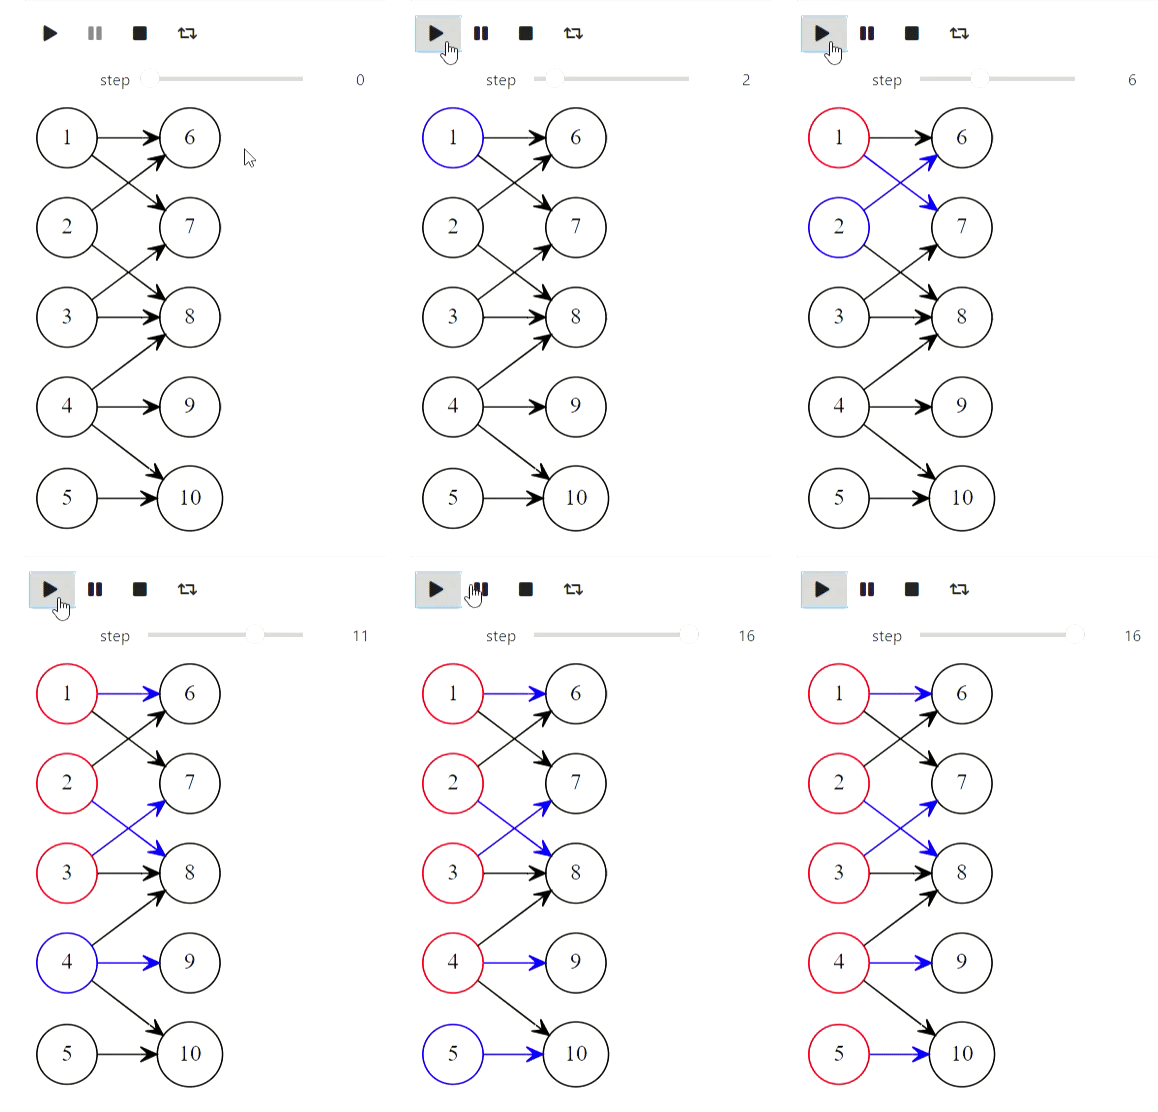
Et enfin, l'algorithme de Kuhn pour trouver la correspondance maximale:
Le code
def mark_for_delete(arc):
    arc.SetColor('red')
    arc.SetStyle('dashed')

def mark_for_add(arc):
    arc.SetColor('blue')

def clear(arc):
    arc.SetColor('black')
    arc.SetStyle('solid')

def find_augmenting_path(graph, node_id, visited, match, deleted):
    if node_id in visited:
        return False
    visited.add(node_id)
    for arc in graph.nodes[node_id].arcs:
        if arc.end not in match or find_augmenting_path(graph, match[arc.end].beginning, visited, match, deleted):
            if arc.end in match:
                mark_for_delete(match[arc.end])
                deleted.append(match[arc.end])
            match[arc.end] = arc
            mark_for_add(arc)
            return True
    return False

def kuhns_matching(graph, first_part):
    states = [graph.Visualize()]
    match = dict()
    for node_id in first_part:
        node = graph.nodes[node_id]
        node.SetColor('Blue')
        states.append(graph.Visualize())
        deleted = []
        if find_augmenting_path(graph, node_id, set(), match, deleted):
            states.append(graph.Visualize())
            for arc in deleted:
                clear(arc)
            states.append(graph.Visualize())
        node.SetColor('red')
    states.append(graph.Visualize())
    return states

arcs = [
    Arc(1, 6),
    Arc(1, 7),
    Arc(2, 6),
    Arc(3, 7),
    Arc(3, 8),
    Arc(4, 8),
    Arc(4, 9),
    Arc(4, 10),
    Arc(5, 10),
    Arc(2, 8)
]
first_part = [1, 2, 3, 4, 5]
graph = Graph(arcs)
states = kuhns_matching(graph, first_part)

animate_list(states, play=True, interval=400);
Résultat

Algorithmes avec matrices
Mais cette partie fait référence à la tentative ratée. IPython.display peut analyser le latex, mais quand j'ai essayé de l'utiliser, c'est ce que j'ai obtenu (il aurait dû y avoir une méthode gaussienne):
Le code
from animation_utils.latex import Matrix
from IPython.display import Math

n = 5
A = np.random.rand(n, n)
L = np.identity(n)
U = np.array(A)
steps = []
steps.append(Math(str(Matrix(L)) + str(Matrix(U))))
for k in range(n):
    x = U[k,k]
    for i in range(k+1, n):
        L[i,k] = U[i,k] / x
        U[i,k:] -= L[i,k] * U[k,k:]
    steps.append(Math(str(Matrix(L)) + str(Matrix(U))))

animate_list(steps, play=True, interval=500);
Résultat


Jusqu'à présent, je ne sais pas quoi faire avec cela, mais peut-être que des personnes bien informées le feront.